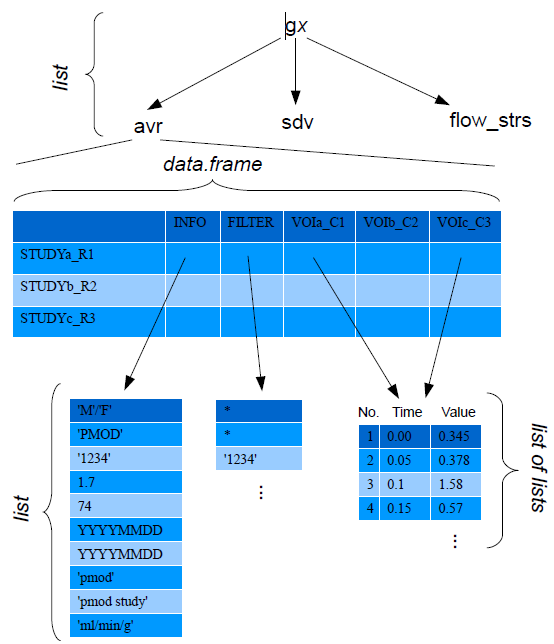
The variables created by the transfer of statistics and aggregates to R or by loading them have the following structure:
▪The names have the form g1, g2, etc if there was not explicit variable name defined.
▪The highest level consists of a list corresponding to the different statistic types such as average and standard deviation for VOI statistics, Vt for aggregated modeling results, etc.
▪The next level is a data frame with a header line and data rows. The data rows correspond to the rows in an aggregate and are thus dependent on the aggregated data. Typically, the rows correspond to the different subjects in a population.
▪Each cell in the data frame table is in itself a list. The list structure depends on the aggregated table and on the column. An INFO list contains demographic data, while a VOI list contains 3 lists for the elements "number", "time" and "value".
Most PMOD scripts require the specification of which part of a variable should be processed. Therefore, they show dialog windows such as the one illustrated below.
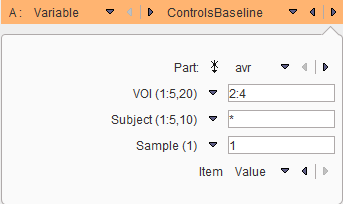
After choosing a Variable, the elements in the lower part are updated according to the variable contents. Parameter represents the statistics to be analyzed. The VOI selection corresponds to the columns, the Experiment to the rows, and the Sample to the location in the value or time list. Item finally allows switching from Value to Time, if the acquisition timing rather than the sample value is needed.
The selections in text fields represent standard R expressions, for example:
▪Use all available elements, eg all VOIs: "*"
▪Use a range, e.g. elements 2 to 4: "2:4"
▪Use one specific element, e.g. the first: "1". It can be combined with a range in the form of e.g. "1, 3:5".
As a convenience, the shortcut button![]() propagates the "*" definition to all components.
propagates the "*" definition to all components.