The contents of variables in the R workspace can be plotted in various ways. Note, however, that the structure of the aggregates used for comparative plotting (eg. scatter plots) needs to be identical, meaning that the number of rows and columns as well as the sorting order must be the same. No attempt is made to pair corresponding data.
The ![]() button switches the R console to the Plotting Layout as illustrated below.
button switches the R console to the Plotting Layout as illustrated below.
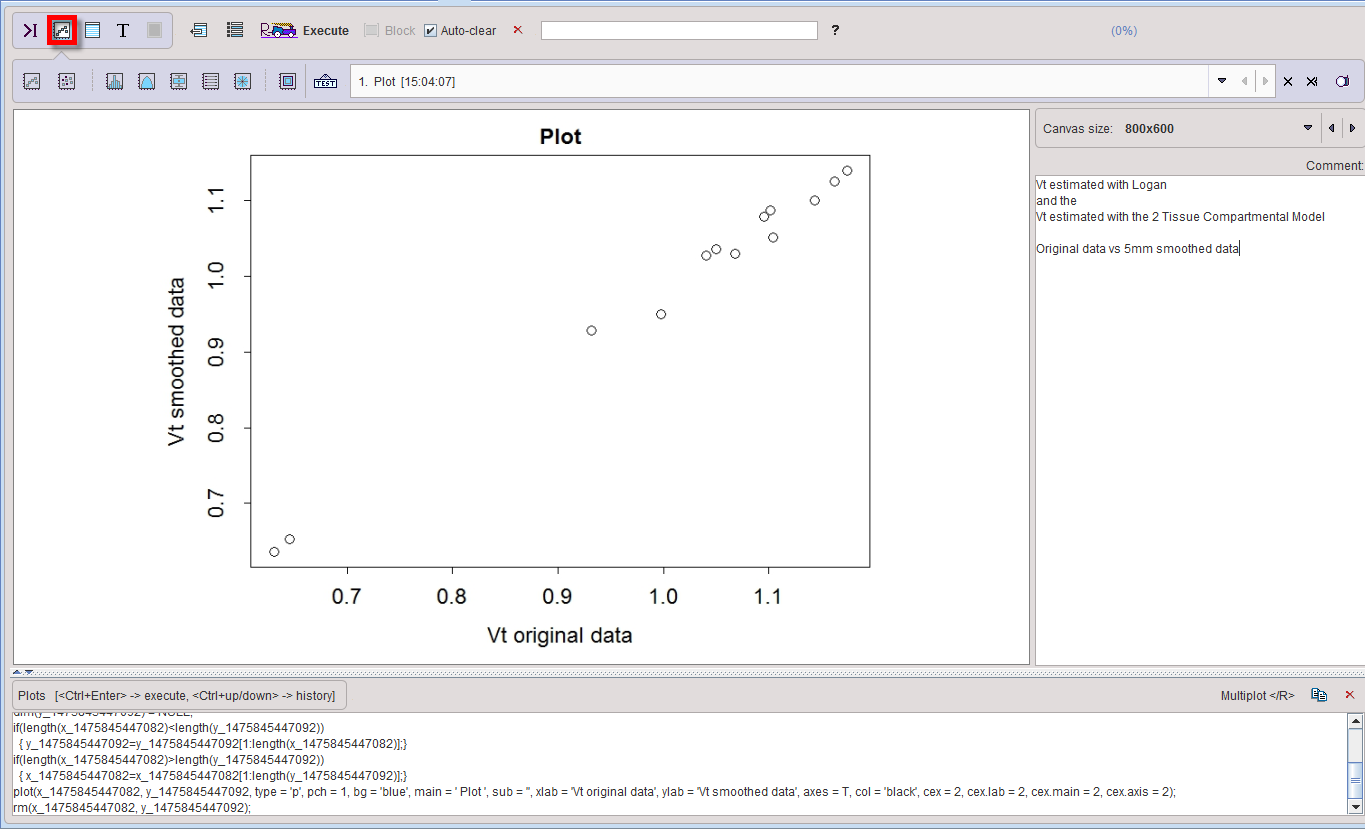
The different available types of plots are represented by the icons in the upper left. When one of the plot icons is activated, it shows a dialog window for the specification of the input data and the plotting parameters.
Plotting User Interface
The interface for the different plots shares common features. The example below shows the Plot interface.
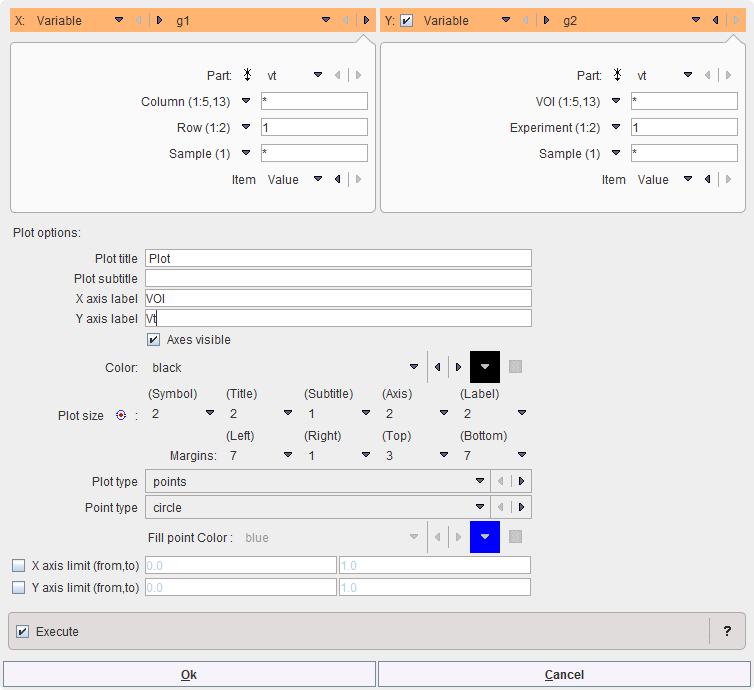
The upper part represents the specification of the data to be plotted, as described above. Depending on the situation, one or more data sets labeled A, B, C can be plotted. Some plots may generate variables which are of general interest. They are labeled with Variable prefix so that they can easily be identified in the workspace.
Most Plot options are straightforward, except for the Plot size. It relates to the default size of the R plotting function, which is variable. The plot sizes may need adjustment, when the canvas size is changed.
Plotting Code
From the specification in the dialog window R code is generated. If the Execute flag is enabled, the code is immediately executed and the graphics is shown in the main window. Otherwise the code is added to the history of the Plots command window and may be edited before execution, for instance to change a plotting option.
All executed code is added to the history of the Plots command window. On demand prior code can be recovered using the keyboard keys Ctrl+Up-arrow and Ctrl+Down-arrow similar to the command window.
Plot Buffer
The plots created by any plotting actions (including scripts) end up in a plot buffer, so that they can be inspected at any time during a processing session by simply switching the list.
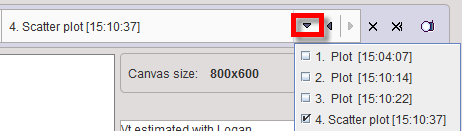
The buffer list can be edited with the buttons to its right:
|
Remove current table from the list. |
|
Clear the buffer list. |
|
Save the graphics to a file. |