The scatter plotting function is called with the ![]() button and opens the following dialog window.
button and opens the following dialog window.
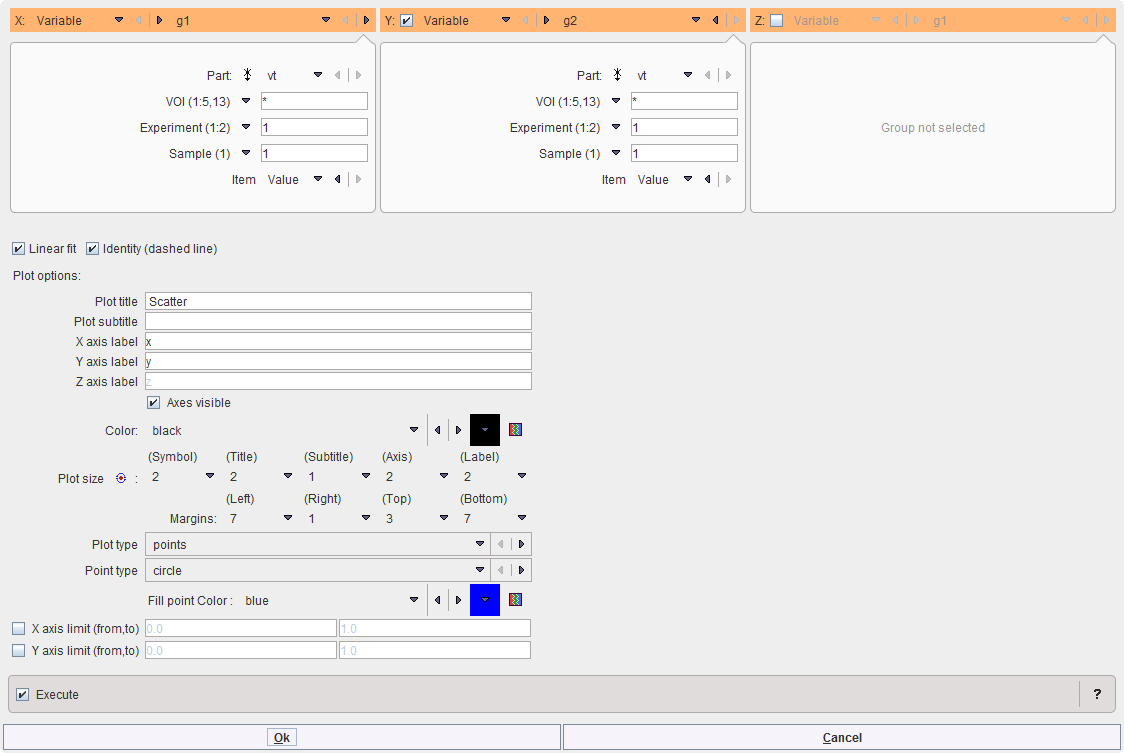
Typically, the values of variable A will be plotted against variable B. If a third variable C is enabled (option), the plot is shown as a 3D scene in the PMOD 3D rendering tool.
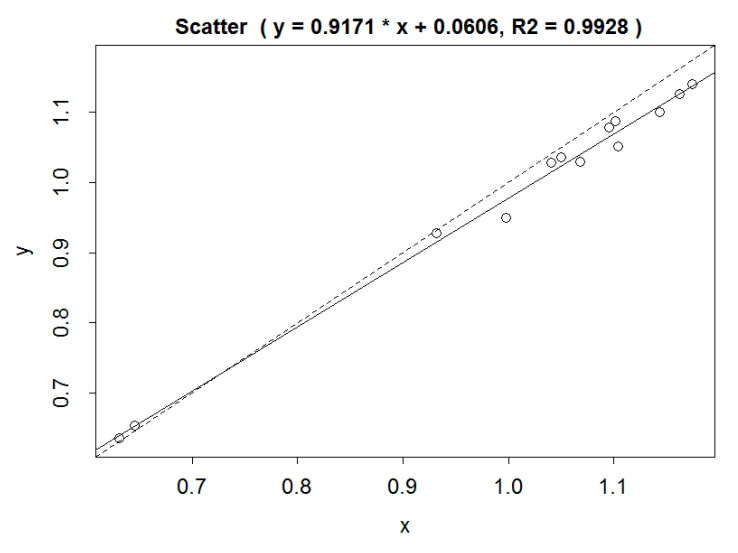
The example below shows a scatter plot with a fitted regression line.