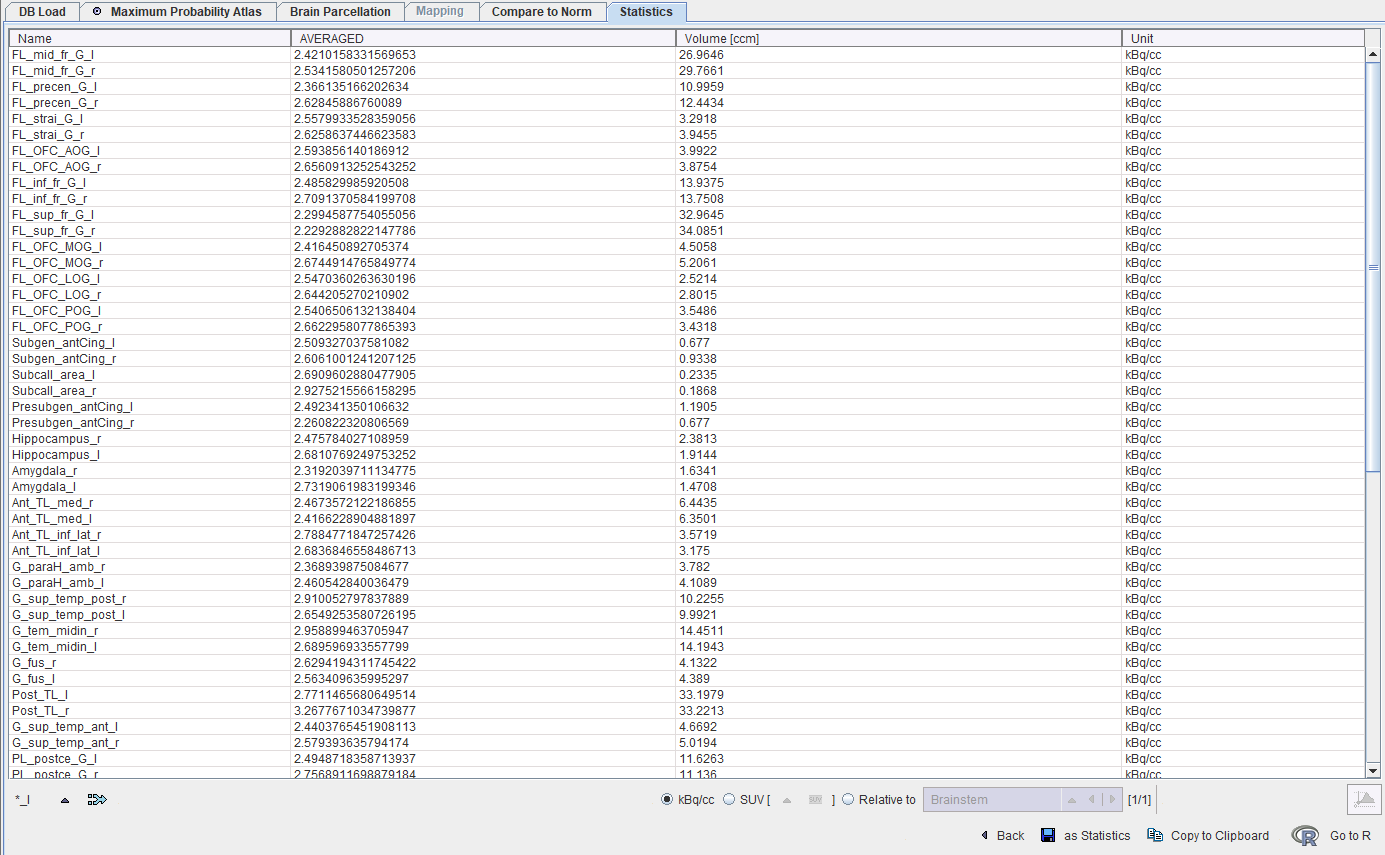
If the VOIs are applied to static data, the Statistics page only shows a table of the main outcome parameter. In the case of a static PET the list shows the tracer average uptake in kBq/cc (AVERAGED) and the VOI volume in ccm.
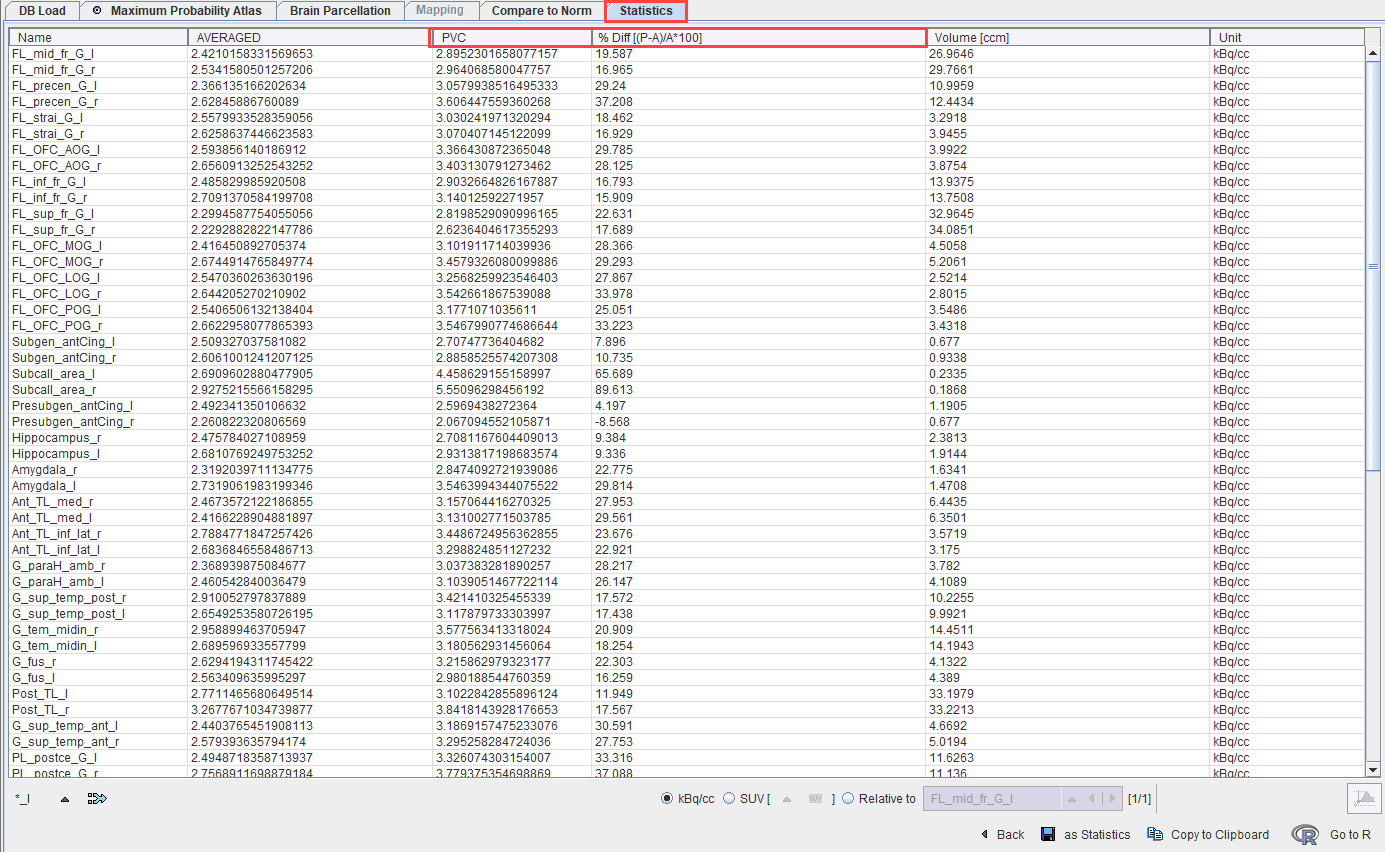
When a PVC method is applied, two additional columns are available in the list after the tracer average uptake: the tracer average PVC corrected value and the percentage difference between the non corrected and the corrected value:
Please use the regular statistics button ![]() on the VOIs page to get the full statistics output.
on the VOIs page to get the full statistics output.
SUV Statistics
If the statistics are calculated for activity concentration images, the uptake results can be converted to different types of SUV images, assuming that the related activity information and subject weight/height is available in the image header. If the information is not available in the image header, but is available via lab records etc., it can be entered after activating the SUV button.
SUVR Statistics
The so-called SUVR statistic is the uptake divided by a reference region uptake. It can easily be obtained by switching to the Relative to radio button and selecting the reference region from the VOI list. Note that the ratio is also calculated for all the other statistical measures.
Transfer of Statistics to R
The Go to R button transfers the average and volume statistics to the R server, generating one R variable in the R workspace.