Starting the PVC
As a first step, load the brain PET images into the PVIEW tool. Loading of the MR series is not required at this stage. Then activate the ![]() button to the right of the image and select the PVC (Brain MR based) method on the list of external tools. A dialog window is shown which allows performing the processing in a step-by-step mode or as a background process.
button to the right of the image and select the PVC (Brain MR based) method on the list of external tools. A dialog window is shown which allows performing the processing in a step-by-step mode or as a background process.
Note the following:
1.Minimally, the user has to provide an anatomical MRI image.
2.It is recommended to inspect and analyze the outcome of the PVC procedure, for instance the outcome of the segmentation and the PET-MR matching. To this end, Additional results can be returned. The user should make sure that with the background mode the corresponding boxes PET matched to MR, Brain Segments and Grey mask are enabled before closing the window with the Ok button.
3.If the Replace box is checked the original images are replaced by the partial-volume corrected images.
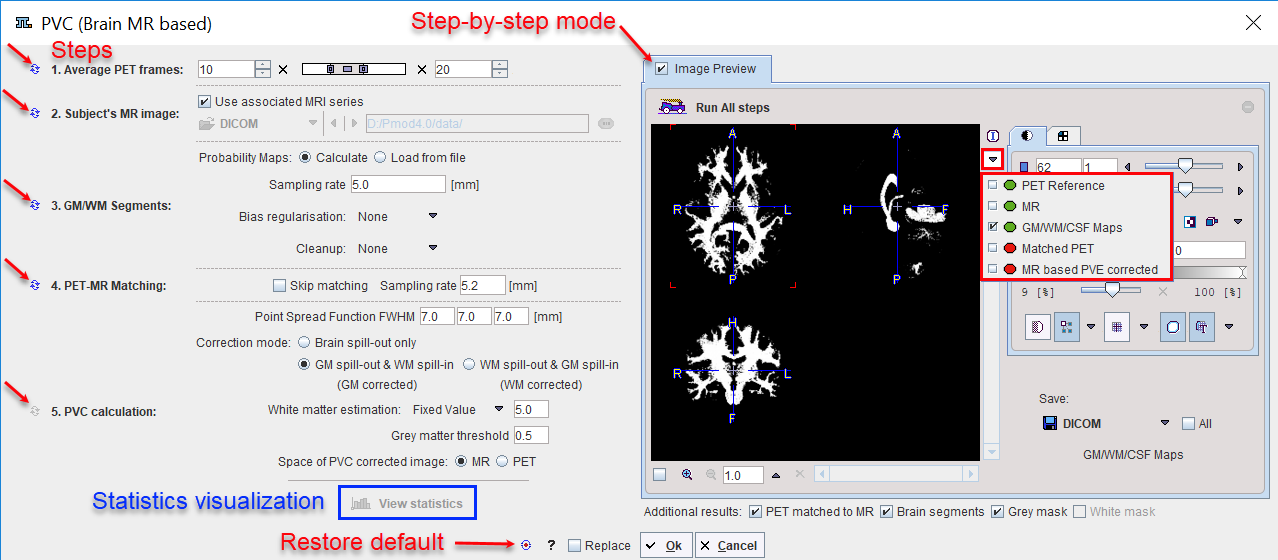
Step-by-Step PVC Processing Mode
The step-wise mode is activated by checking the box next to the Enable preview label. Note the ![]() buttons along the left border which are used to activate the individual processing steps. Initially, most of them are inactive because the prior steps are missing. In the example above, steps 1 - 3 have been performed. Therefore, step 4 can also be started, but step 5 not yet as it requires that the images have already been matched.
buttons along the left border which are used to activate the individual processing steps. Initially, most of them are inactive because the prior steps are missing. In the example above, steps 1 - 3 have been performed. Therefore, step 4 can also be started, but step 5 not yet as it requires that the images have already been matched.
Note that the result images of the different steps are collected in the Image Preview area. In the image selection list, available results appear with a green mark, while yet unavailable ones are marked in red. The example above shows the WM map calculated by step 3. The images selected in the Image Preview can be exported for later use by the Save button.
The advantage of step-wise processing is that the steps can be repeated with different parameters until the outcome is satisfactory.
1. Average PET frames:
Dynamic PET images can be processed and will result in a corrected dynamic series. However, for the matching in step 4, a static PET image showing anatomical information is required. Therefore, the user should define a suitable range for averaging time frames and then activate ![]() . In the case of a static scan, as in the example above, this step is not required and therefore not active.
. In the case of a static scan, as in the example above, this step is not required and therefore not active.
2. Subject's MR image:
The user must specify an anatomical MR image which will be segmented. He can choose the format, select the image and then activate ![]() for loading the MRI.
for loading the MRI.
![]()
The Use associated MRI series box allows taking advantage of the feature that two series can be associated as a pair in PMOD databases.
3. GM/WM Segmentation:
This step needs to provide the different tissue segments. If Probability Maps is configured as Calculate, the ![]() button calls a segmentation procedure which may take several minutes to complete. The procedure has three parameters: Sampling rate determines the density of pixels considered in the calculation. Bias Regularisation serves for compensating modulations of the image intensity across the field-of-view. Depending on the degree of the artifact, a corresponding setting can be selected from the list. Cleanup is a procedure for rectifying the segmentation along the boundaries. It is recommended to use the default settings and only experiment with other parameter values if the segmentation fails.
button calls a segmentation procedure which may take several minutes to complete. The procedure has three parameters: Sampling rate determines the density of pixels considered in the calculation. Bias Regularisation serves for compensating modulations of the image intensity across the field-of-view. Depending on the degree of the artifact, a corresponding setting can be selected from the list. Cleanup is a procedure for rectifying the segmentation along the boundaries. It is recommended to use the default settings and only experiment with other parameter values if the segmentation fails.
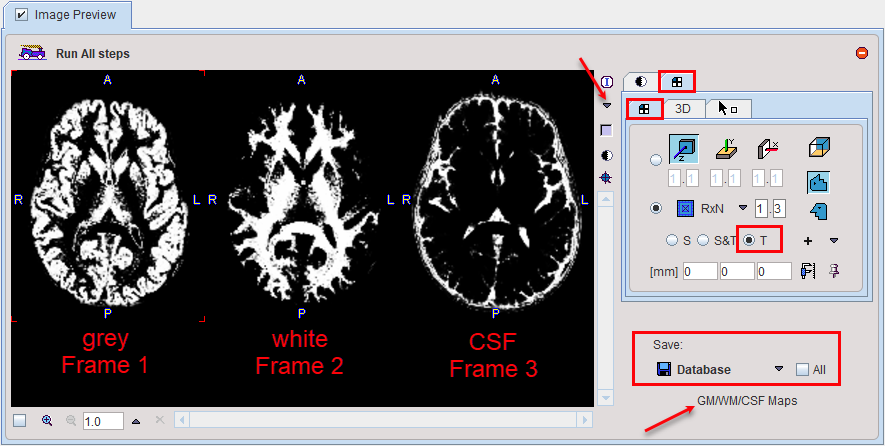
The results are three segments, WM, GM and CSF. They are arranged as frames in a "dynamic" series. In the illustration below, the three frames are arranged in three columns. Because the calculation takes long it may be helpful to save the segment images for later use by selecting them in the Image Preview and then using the Save button.
If segment images are already available, Probability Maps can be configured as Load from file, and the corresponding segment file selected. Note that the segment images must be matched to the MR image and different segments should appear as dynamic frames in the indicated order. In this case the ![]() button just loads the segments.
button just loads the segments.
4. PET-MR Matching:
Upon activating the ![]() button, the PET image is rigidly matched to the selected MR image. If the matching fails, the Sampling rate can be reduced and matching tried again. In case the images are known to be already matched, the Skip Matching box can be checked in order to skip the matching step. However, please note that in this case the MRI and the PET images must have identical pixel size and image matrix. If automatic matching in the PVC tool is not feasible, matching can be performed manually in the fusion tool and the results saved for use in the PVC tool.
button, the PET image is rigidly matched to the selected MR image. If the matching fails, the Sampling rate can be reduced and matching tried again. In case the images are known to be already matched, the Skip Matching box can be checked in order to skip the matching step. However, please note that in this case the MRI and the PET images must have identical pixel size and image matrix. If automatic matching in the PVC tool is not feasible, matching can be performed manually in the fusion tool and the results saved for use in the PVC tool.
5. PVC Calculation:
The last step is the actual partial-volume correction procedure which has several parameters.
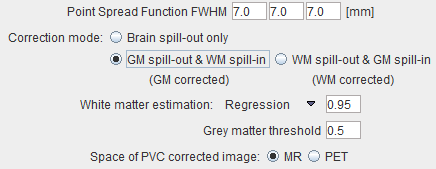
The Point Spread Function FWHM represents the assumed point-spread function. Default is 7 mm isotropic FWHM.
The Correction mode is normally set do GM spill-out and WM spill-in to obtain an image with corrected gray matter pixels. WM spill-out and GM spill-in is useful in situations where the main uptake is in WM and the corrected WM pixels are the target of the analysis. If, the segmentation of white and grey matter does not give an accurate result, the correction can be reduced to Brain spill-out, resulting in all brain pixels corrected for mutual spillover and for spill-out of the brain.
The White matter estimation provides three choices: Default is the Regression approach. It collects the PET uptake of all pixels with a WM probability higher than the specified value (e.g. 0.95), and performs a linear regression to estimate the WM value at the probability of 1. [5] With Average, the average is calculated instead of using the regression. Finally, the user can specify a known WM uptake value with the Fixed value setting.
The PVC is only appropriate for GM pixels. All other pixels in the corrected image may therefore not be evaluated and are masked. To this end, a Grey matter threshold can be specified. It is applied to the convolved GM segment for getting a smooth appearance. Note that if the threshold is small, outlier values might appear along the mask boundaries as over-correction artifacts.
The PVC correction is always performed in the space of the MR image using the matched, interpolated PET image. If Space of PVC corrected image is set to MR, this corrected PET series is returned as-is. With the PET setting, however, the corrected series is transformed to the PET space using the inverse of the PET to MR transform.
6. View Statistics:
This button calculates the VOI statistics in the original and the PVC corrected images. Depending on the input images the results are simple statistics, or tissue time-activity curves for the gray matter.

The statistic results can be saved as a .voistat file with the Save Statistics button. In alternative, the Before PVC and After PVC content of the page can be copied to Clipboard and paste in Excel.
Returning the Results:
Before closing the window make sure that the appropriate Additional results boxes are checked, then select the Ok button.
Background PVC Processing Mode
If no interactive processing is required, the PVC procedure is very easy. Only the following actions are required:
1.If the PET data is dynamic, the averaging range has to be defined.
2.The anatomical MRI has to be selected.
3.If desired, some of the parameters can be edited in the different processing steps, or they can be reset by the ![]() button.
button.
4.The appropriate Additional results boxes should be checked.
5.The PVC can be started with the Ok button.
The window will be closed and processing will run in the background for several minutes. Once the results were calculated and returned to PVIEW, a confirmation message will be shown.
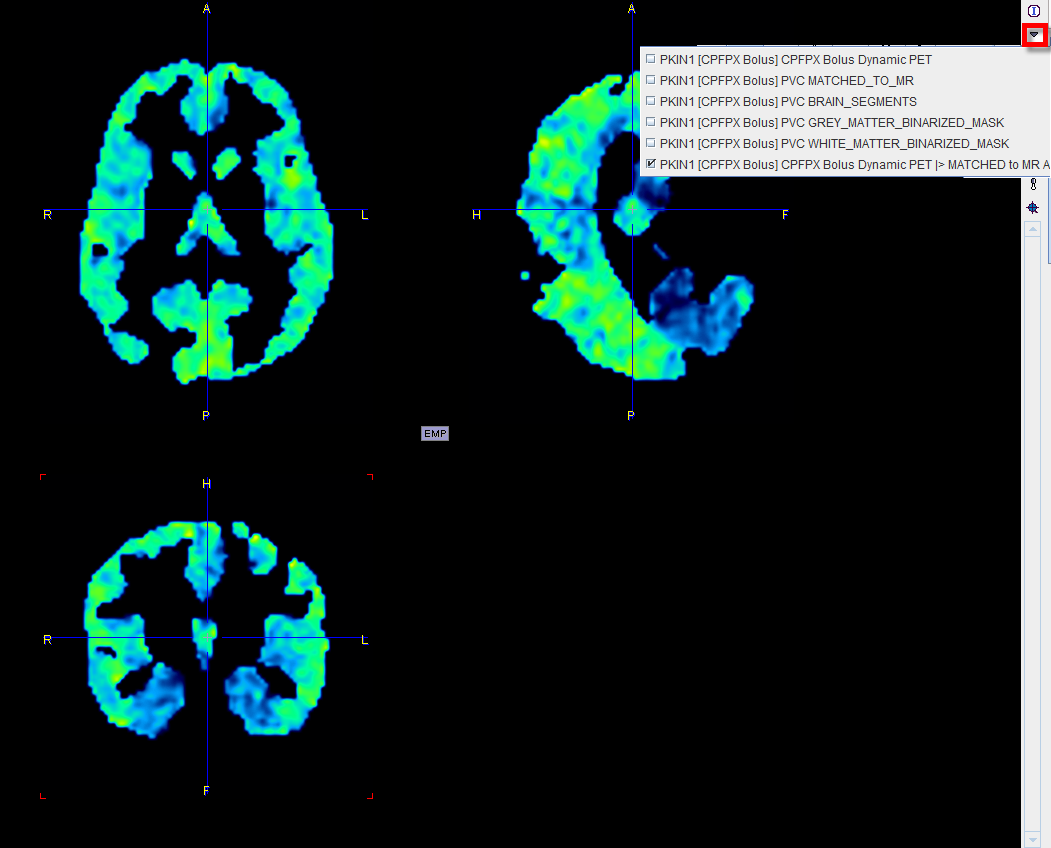
Result Images
The results are returned as additional image series, as illustrated below. The original data is the first on the list, then come three auxiliary image series, and the last series marked by PVE CORRECTED is final outcome of PVC. Note the masking which may cause the disappearance of GM pixels if the cortex is thin and the PET resolution low.